You have access to up to date seasonal charts for any asset you want.
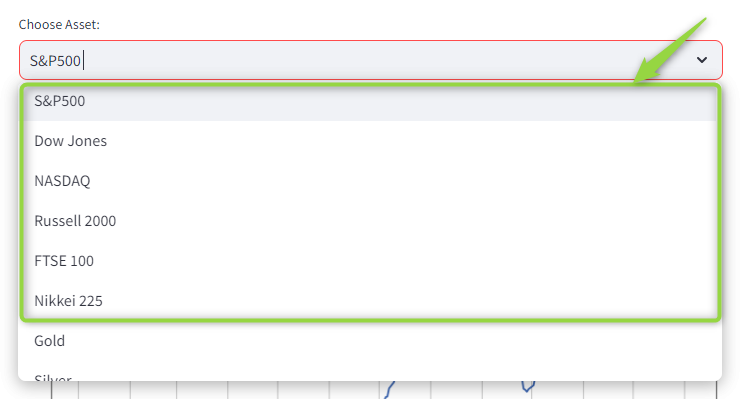
Indices?
Yes.
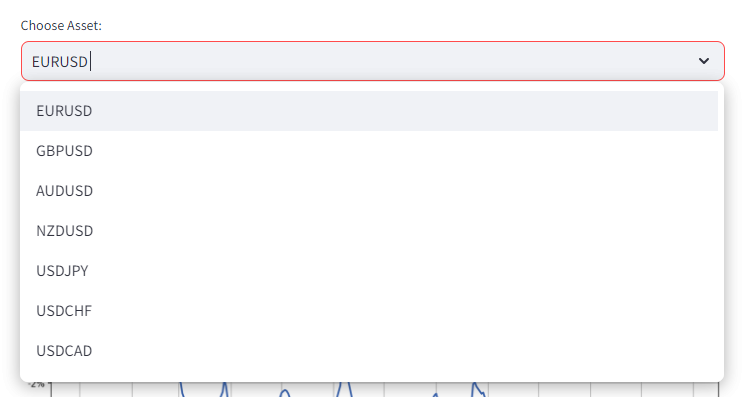
Currencies? All of them yes, majors, minors, and exotics.
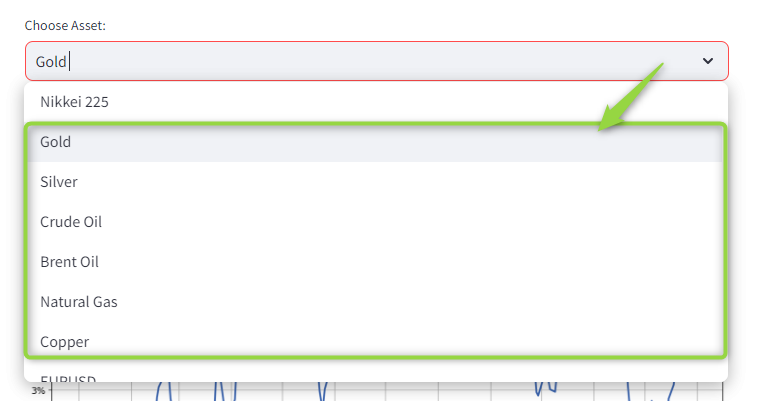
Commodities?
Absolutely.
Now the question becomes…
HOW IS THIS USEFUL?
Well, if you have seen these seasonal charts around already you certainly know how useful these are.
But if you are not, then let me show you some practical applications.
Ok, before we get into some examples.
what exactly is a seasonal chart?
Basically…
Specific assets in specific periods of the year tend to have flows that repeat year after year.
Think of it as trends that repeat annually in specific periods of the year.
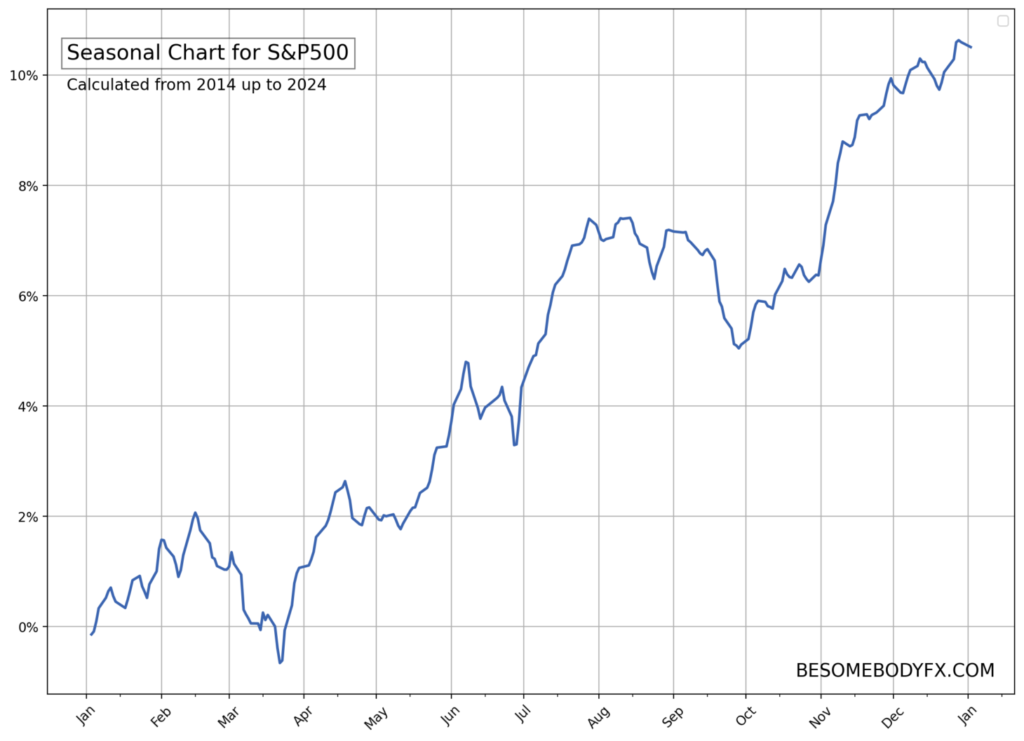
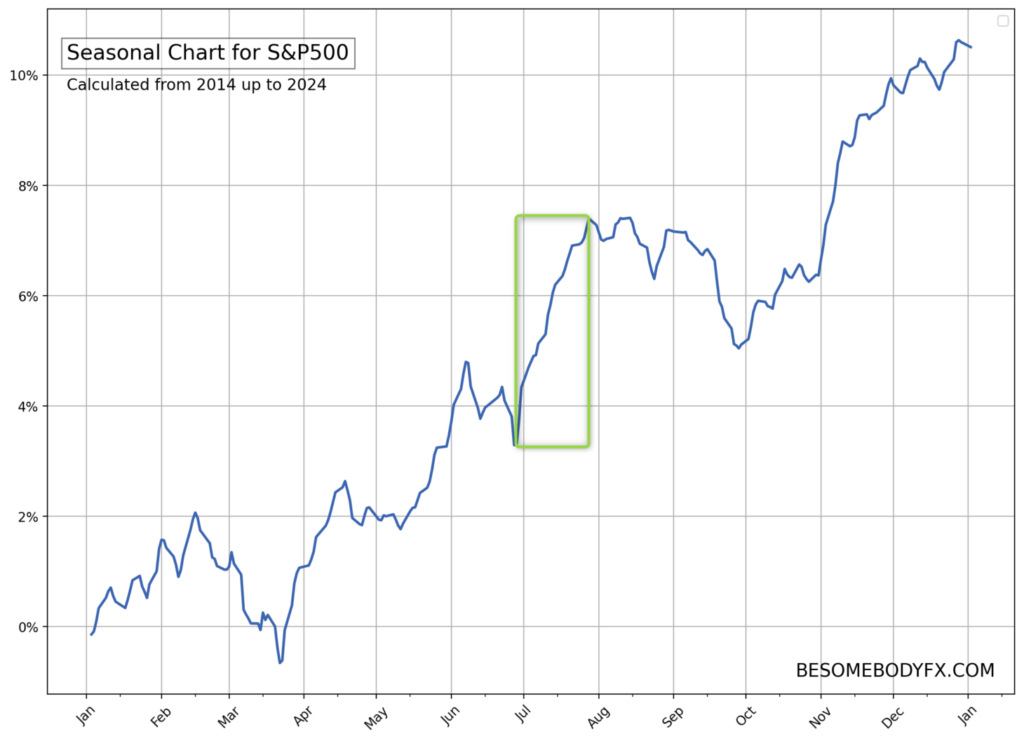
Here’s the S&P500 for example:
There are many instances here of seasonal patterns but let’s take a random one.
Look at the chart from late June to late July…
Notice the impulsive rally on the seasonal chart during this period?
That’s not random.
That’s a seasonal trend.
The S&P500 in specific period of the year ALWAYS tends to rally.
Literally.
Always.
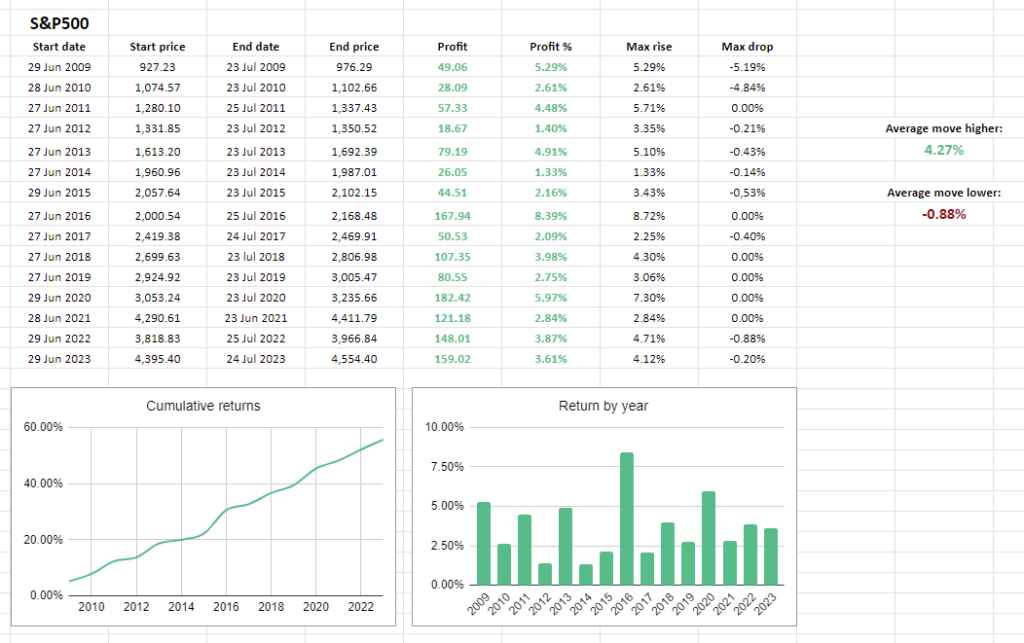
Here’s exactly the S&P500 year by year between June 27 and July 24:
Interesting right?
But why that happens?
Well, the market is not made just of speculators.
There are many flows like commercial activity and portfolio rebalancing.
The start of July is a particularly interesting one because it marks the start of Q3, and so the turn from the first half of the year to the second half.
So we can imagine there are some sort of repeated flows that have to happen regularly at that time of the year for reasons related to the turn of the quarter and the start of the second half of the year.
We can’t know for certain.
But that’s what the seasonal charts are there for.
They show us when those seasonal patterns happen.
THE POINT?
The point is that we can use these moves to our advantage.
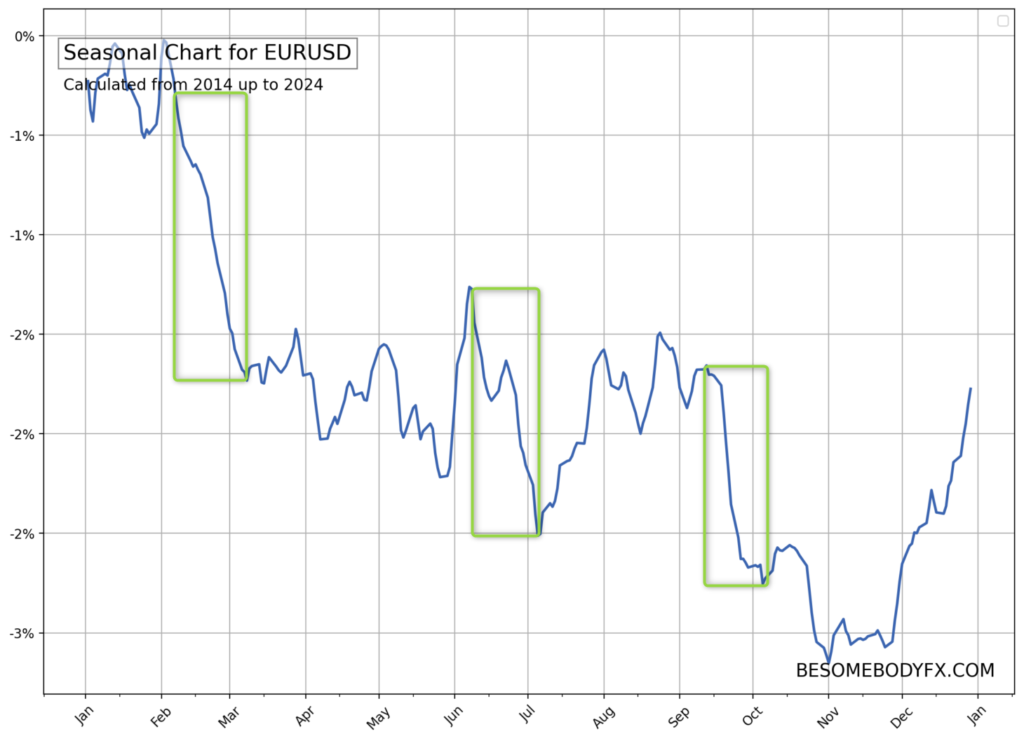
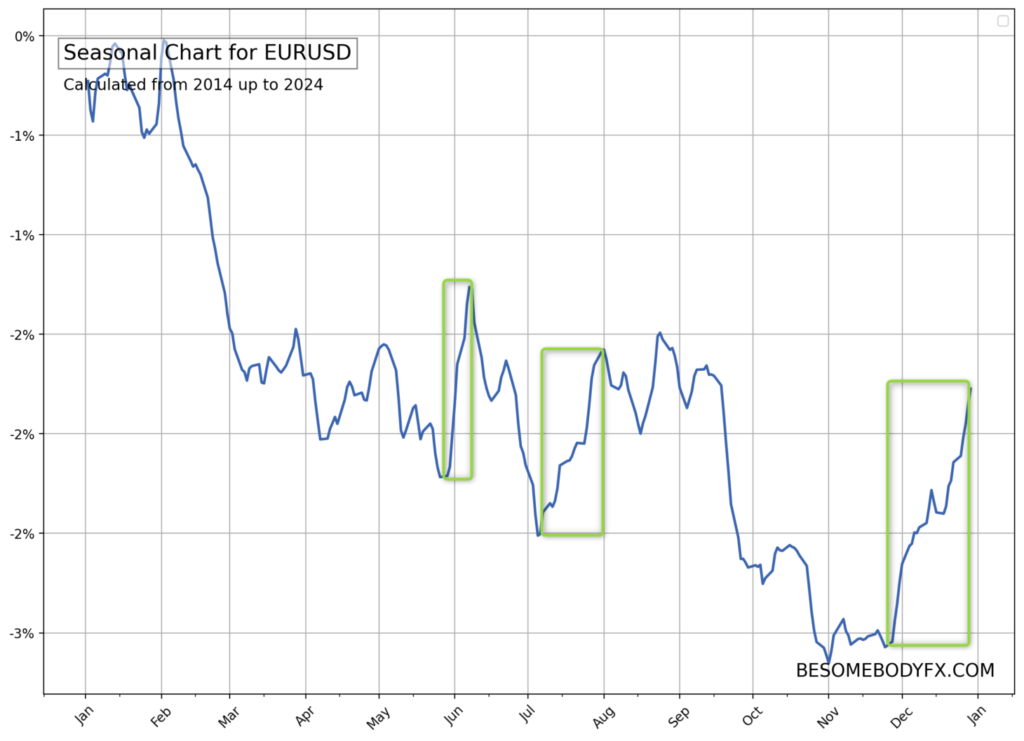
Same happens in currencies, of course.
There are specific seasonal periods where there’s historically more demand for Dollars.
And other periods where there’s less.
And the same is true for all other currencies, and commodities, and to some extent crypto too.
IN OTHER WORDS…
Seasonal charts allow us to spot these patterns to first avoid getting caught in the wrong direction of one of these seasonal flows, and second ideally position for it.