Trades
besomebodyfx terminal
HOW TO USE THE SEASONAL FLOWS TOOL
Specific assets in specific periods of the year tend to have flows that repeat year after year.
Not exactly the same way.
Not always.
But often enough to matter.
That’s seasonality.
Literally…
Think of it as trends that repeat annually in specific periods of the year.
Here’s the S&P500 for example:
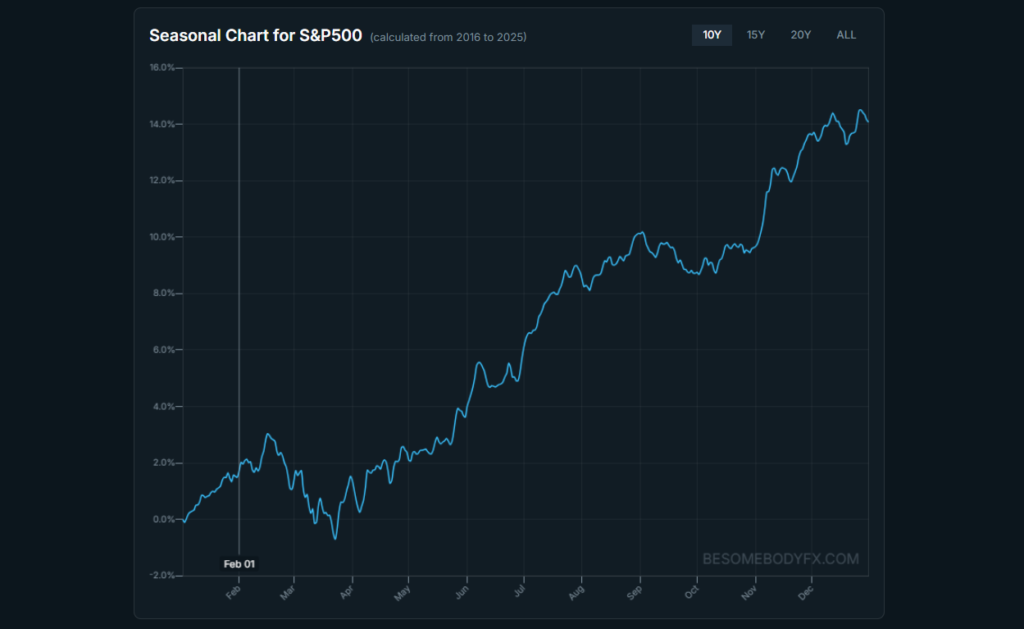
See that chart?
You can interact with it from the seasonality tool.
Click and drag.
Highlight any period.
And instantly, you see the history, the probability, the edge.
This is important.
You don’t have to type dates or think too hard.
Just highlight across the seasonal chart where something looks interesting. The dates update automatically.
This is how patterns are usually spotted, visually first, analytically second.
now here’s where it gets interesting…
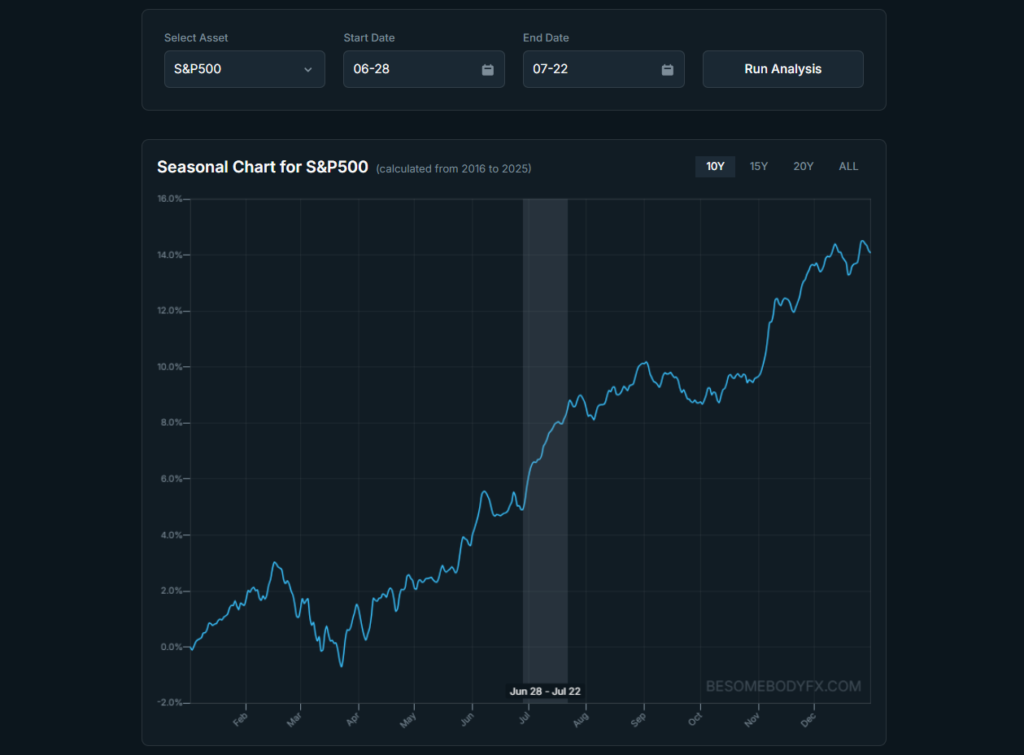
That’s not random.
That’s a seasonal trend.
The S&P500 in that specific period of the year ALWAYS tends to rally.
Literally.
Always.
How DO WE KNOW?
That’s what the tool allows us to do.
Click and drag your mouse to that specific flow on the chart (tap and hold if on mobile) and the data instantly pops up.
Interesting right?
But WHY THAT HAPPENS?
Well, the market is not made just of speculators.
There are many flows like commercial activity and portfolio rebalancing.
The start of July is a particularly interesting one because it marks the start of Q3, and so the turn from the first half of the year to the second half.
So we can imagine there are some sort of repeated flows that have to happen regularly at that time of the year for reasons related to the turn of the quarter and the start of the second half of the year.
IN OTHER WORDS…
We can’t know for certain!
But that’s what the seasonal charts are there for.
They show us when those seasonal patterns happen.
THE POINT?
The point is that we can use these moves to our advantage.
Same happens in currencies, of course.
There are specific seasonal periods where there’s historically more demand for Dollars.
And other periods where there’s less.
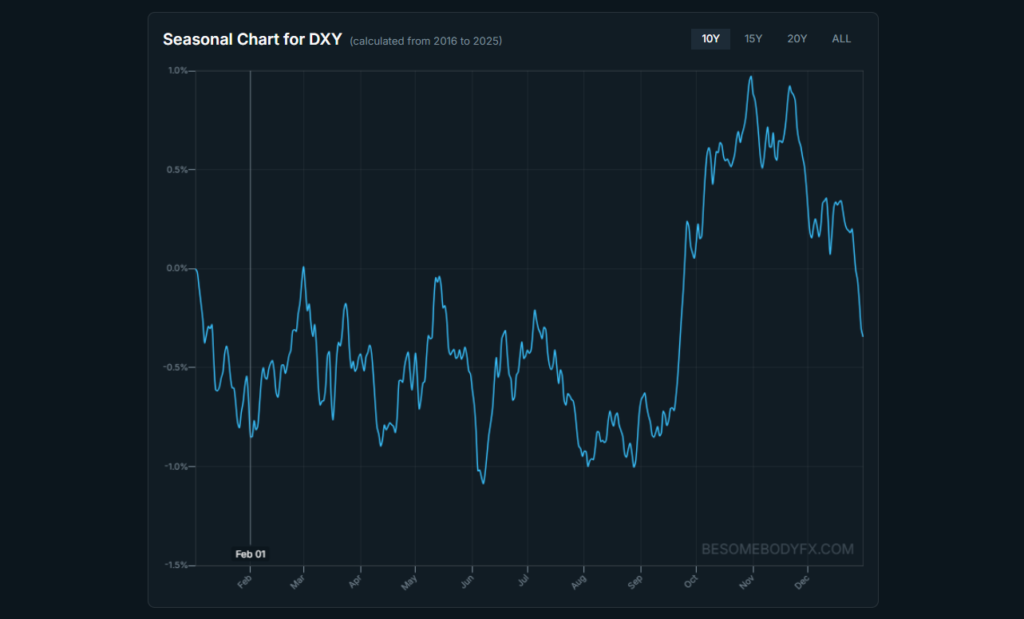
And the same is true for all other currencies, and commodities, and to some extent crypto too.
YOU PICK:
An asset.
A time window during the year.
How many years of history you want to analyze.
And the tool shows you how that exact setup performed in reality.
That’s the whole process. You can do this for any currency, any commodity, any timeframe. It’s your personal seasonality analyst.
HERE’S WHERE THIS LEVELS UP FURTHER…
Some traders love analyzing.
Others just want to know:
“What looks interesting right now?”
That’s what the Seasonal Patterns tab does.
Just a few clicks, and the tool does the work…
It scans the assets, and then outputs the most consistent and strongest seasonal patters, either recently activated, or upcoming.
You can then click a pattern to show a chart of that pattern’s year by year historical performance to see the consistency.
And on top of that you also get a handy button to open that exact pattern in the main section for more details.
This way you always have seasonal patterns on demand.
IN OTHER WORDS…
With this tool first you can avoid getting caught in the wrong direction of one of these seasonal flows, and second ideally position for it.
Simple but REALLY useful.