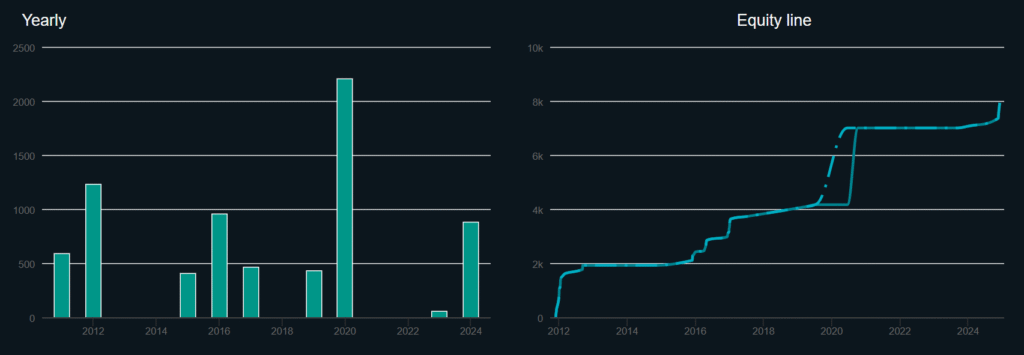
Yes there hasn’t been any trade in 2013, in 2014 and in 2018, 2021, and 2022, why?
Because we didn’t have enough of a correction to trigger a buy signal so no position was opened.
For some this may be a bummer but hey this is an extra tool that you add on your portfolio of trades so it’s extra performance added to what you already perform with regular trading.
This system didn’t generate trades in those years but we have other ways of profiting from the market too, plus don’t forget it’s an extremely “stress free” and effective system, just open the position and cash it after 3 months, don’t forget the value of the profits are relative to the amount of work you put into a position…
It’s more valuable a 40% a year made with just a few hours of work every month/week or a 100% a year made with 8 hours of work everyday?
I will take both because I’m a market junkie  but yeah you get the point…
As much as i would love to say YES, we can’t ever say that for certain as past performance is NEVER indicative of future results.
But hey!
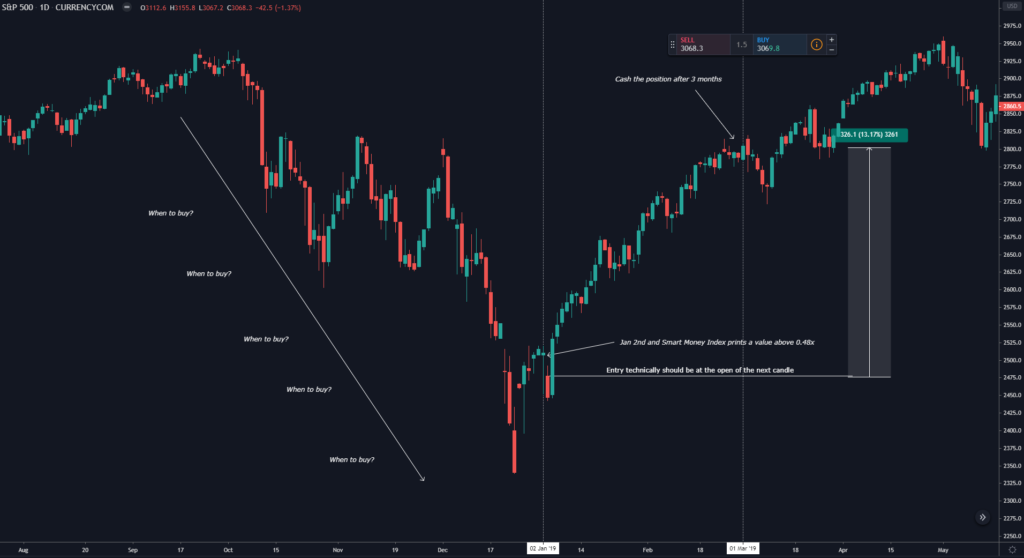
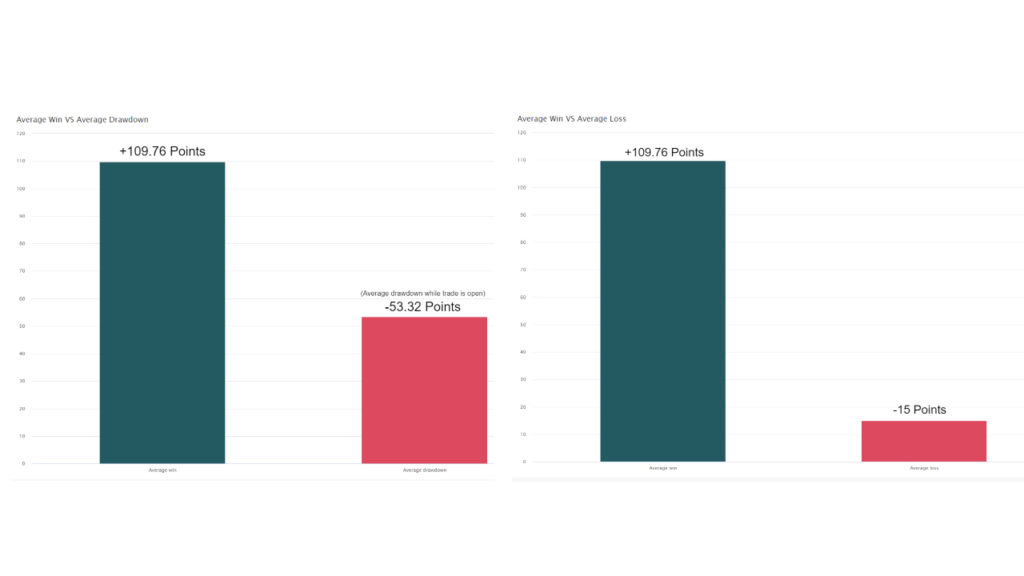
We have something that has proven to work over the past 15 years with great risk reward and stats which give us a high chance of more profitable years ahead, and most of all it’s extremely effective to use and “stress free”. Wait for the signal, deploy your position and wait 3 months to cash your profits, what else you want? I would pay gold for such a system…
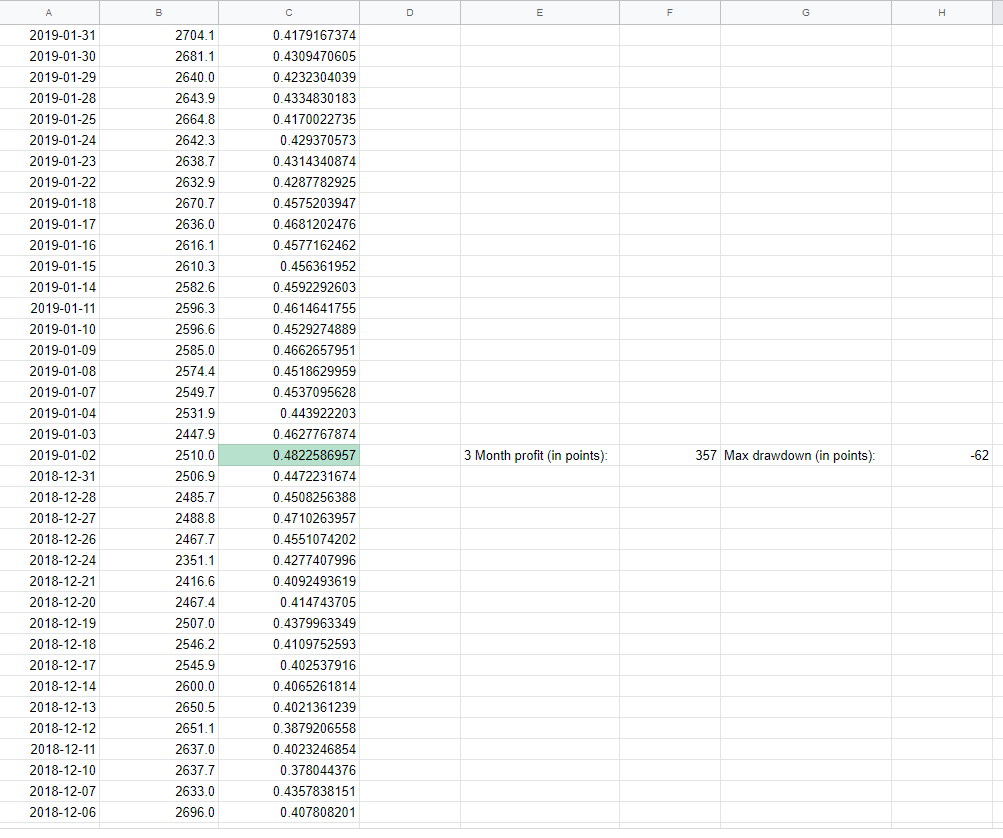
Ah don’t worry you don’t need to opt in the terminal everyday to check where the index is at, we will of course notify you on Telegram every time we get a print above 0.53x 
Enjoy