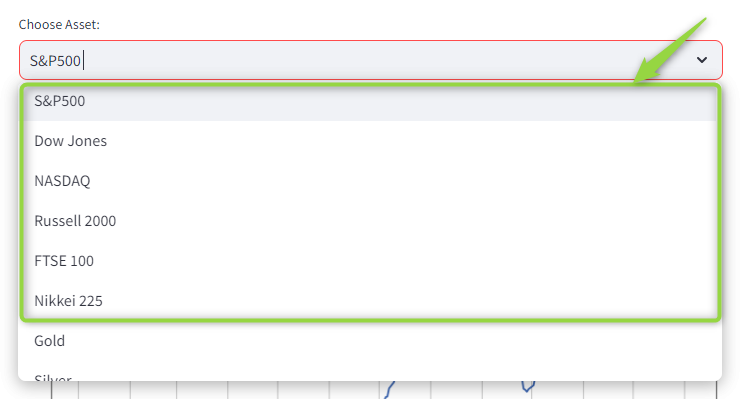
You have access to up to date seasonal charts for any asset you want.
Indices?
Yes.
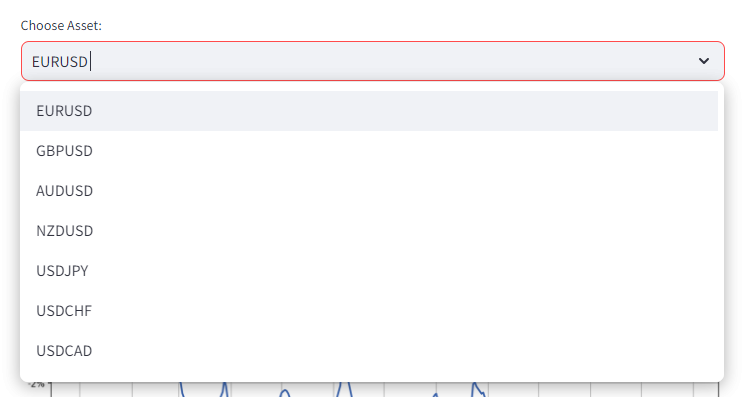
Currencies? All of them yes, majors, minors, and exotics.
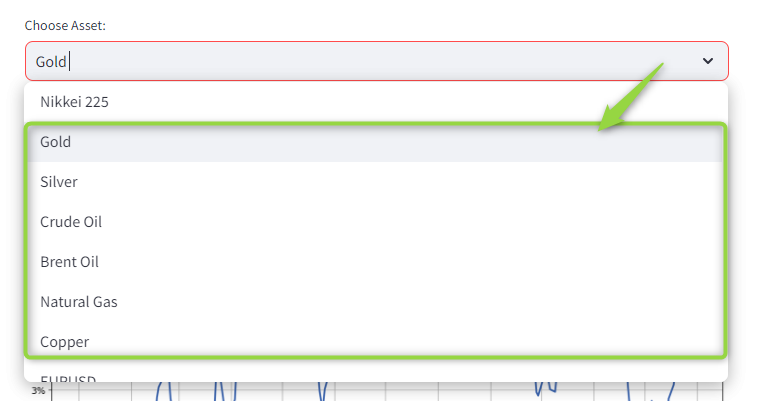
Commodities?
Absolutely.
Now the question becomes…
HOW IS THIS USEFUL?
Well, if you have seen these seasonal charts around already you certainly know how useful these are.
But if you are not, then let me show you some practical applications.
Ok, before we get into some examples.
what exactly is a seasonal chart?
Basically…
Specific assets in specific periods of the year tend to have flows that repeat year after year.
Think of it as trends that repeat annually in specific periods of the year.
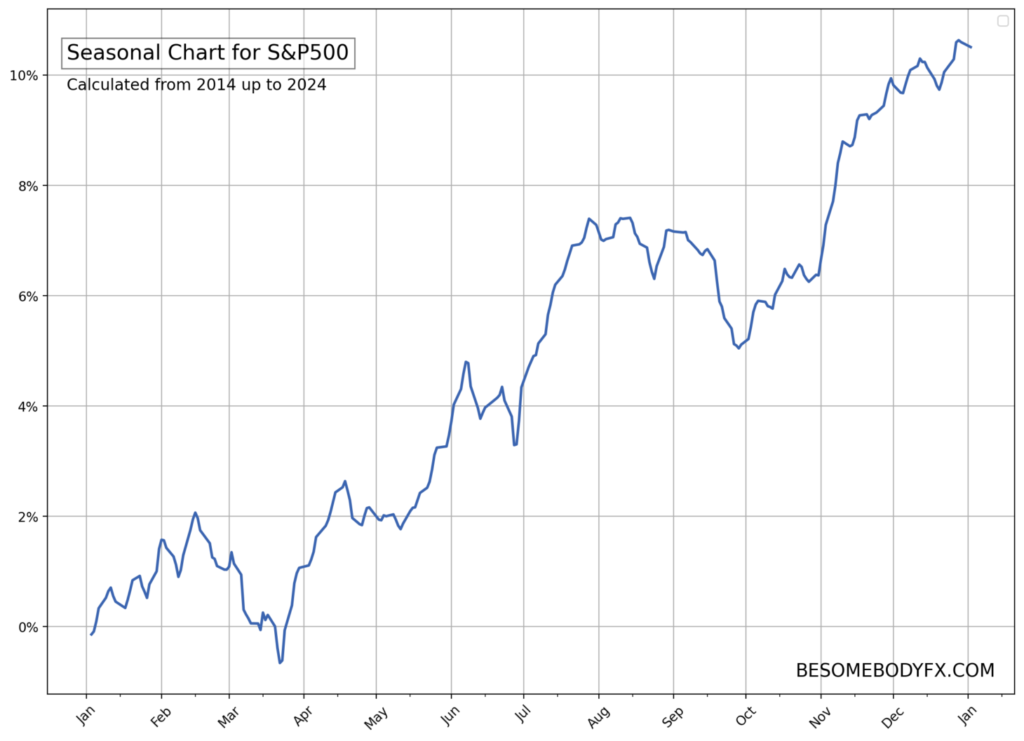
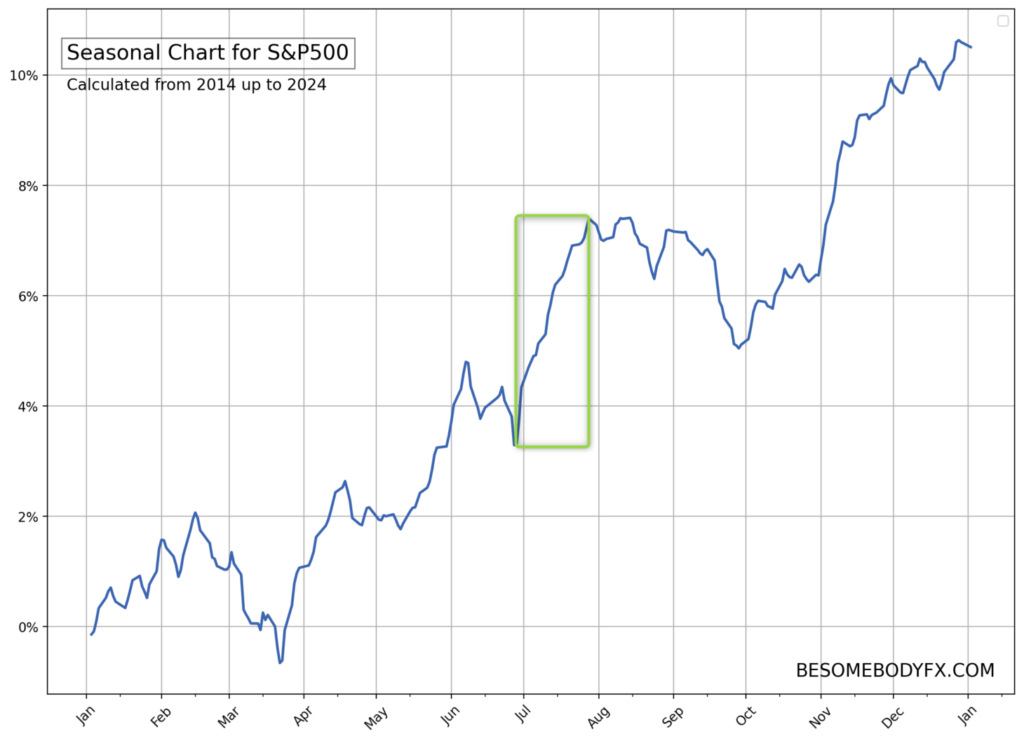
Here’s the S&P500 for example:
There are many instances here of seasonal patterns but let’s take a random one.
Look at the chart from late June to late July…
Notice the impulsive rally on the seasonal chart during this period?
That’s not random.
That’s a seasonal trend.
The S&P500 in specific period of the year ALWAYS tends to rally.
Literally.
Always.
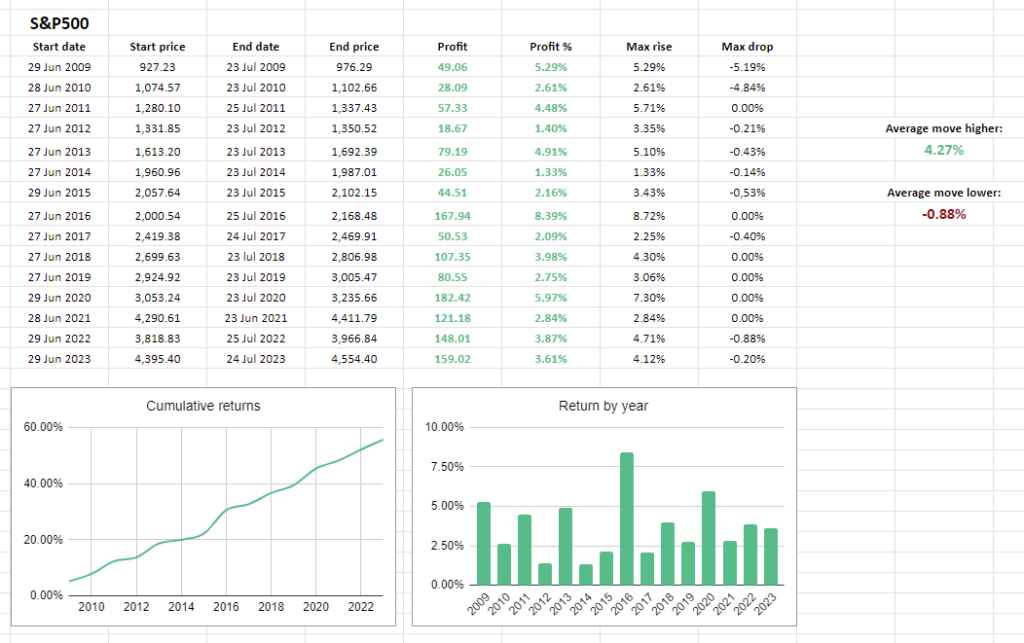
Here’s exactly the S&P500 year by year between June 27 and July 24:
Interesting right?
But why that happens?
Well, the market is not made just of speculators.
There are many flows like commercial activity and portfolio rebalancing.
The start of July is a particularly interesting one because it marks the start of Q3, and so the turn from the first half of the year to the second half.
So we can imagine there are some sort of repeated flows that have to happen regularly at that time of the year for reasons related to the turn of the quarter and the start of the second half of the year.
We can’t know for certain.
But that’s what the seasonal charts are there for.
They show us when those seasonal patterns happen.
THE POINT?
The point is that we can use these moves to our advantage.
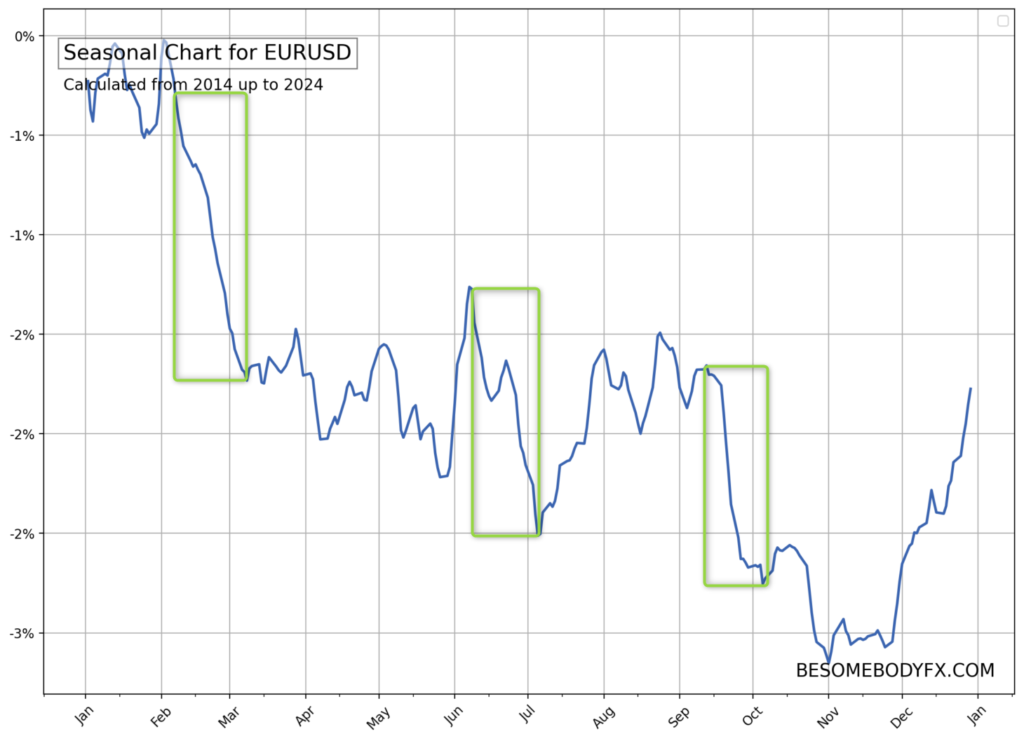
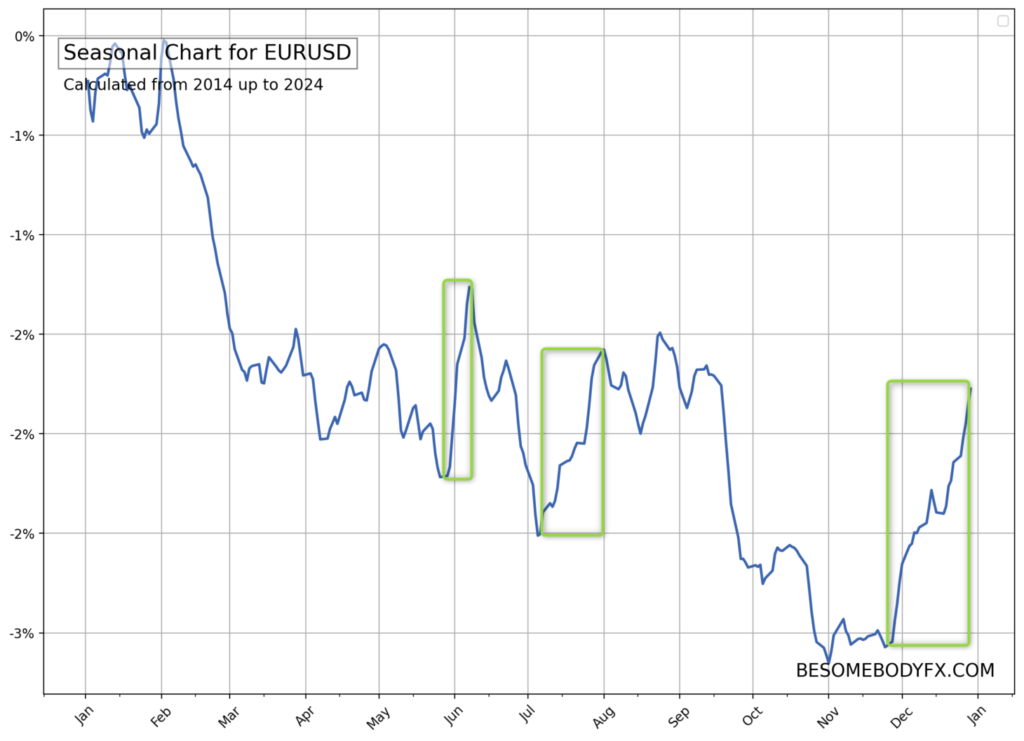
Same happens in currencies, of course.
There are specific seasonal periods where there’s historically more demand for Dollars.
And other periods where there’s less.
And the same is true for all other currencies, and commodities, and to some extent crypto too.
IN OTHER WORDS…
Seasonal charts allow us to spot these patterns to first avoid getting caught in the wrong direction of one of these seasonal flows, and second ideally position for it.
If you try to follow everything manually, you can easily end up with more information but less clarity.
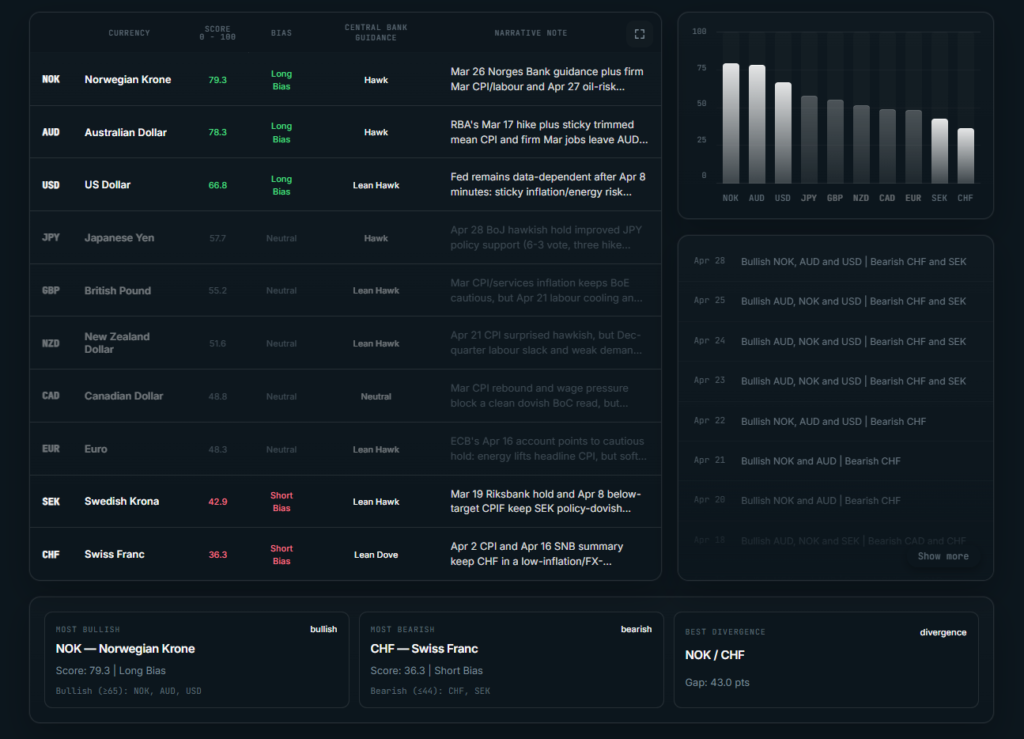
That is exactly why the institutional score exists here.
It is built to answer one simple question:
Which currencies have the strongest fundamental story right now, and which ones look the weakest?
That is it.
But how can you make use of it?
The ideal is simple.
The best trades usually come from pairing strength against weakness.
Not strength against strength.
Not weakness against weakness.
Not two currencies with almost the same story.
You want contrast.
If one currency is supported by a stronger central bank story, better data, better yield support, and a cleaner market backdrop, while another currency is being pressured by the opposite, that is where things get interesting.
The institutional score helps you find those contrasts quickly.
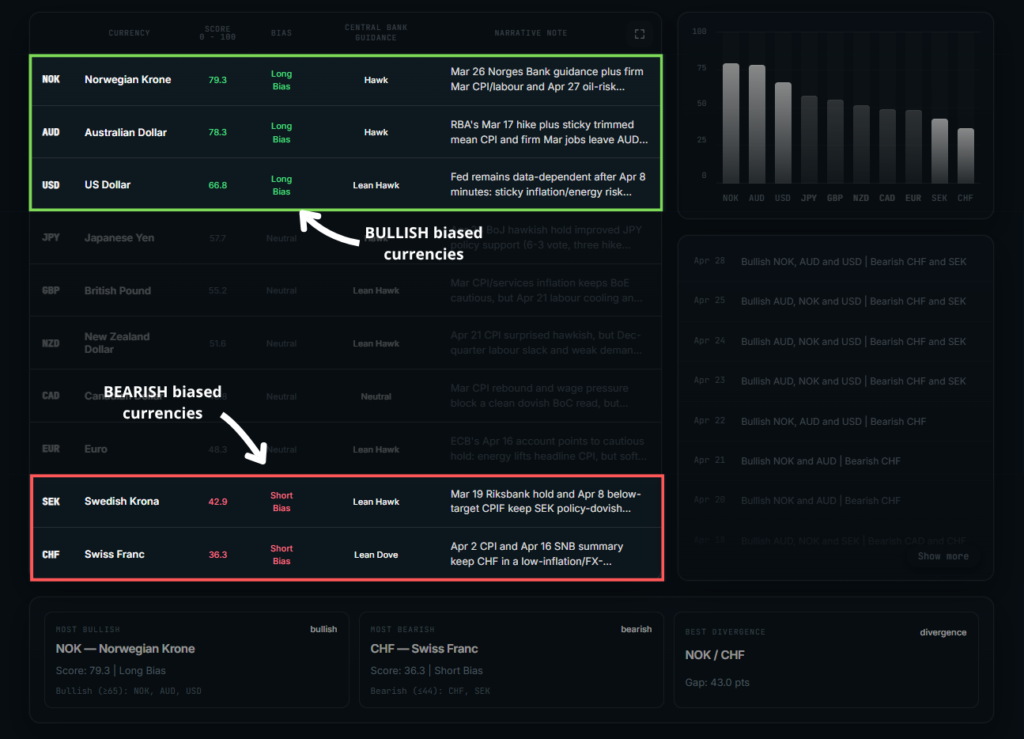
So here's how to use it:
At the top there’s the BULLISH BIASED currencies.
At the bottom there’s the BEARISH BIASED ones.
Fairly straightforward, right?
The strongest currencies are the ones with the best overall fundamental support right now.
The weakest currencies are the ones with the weakest overall fundamental context right now.
And that’s all to be honest.
That’s all you need.
Think of it as a macro filter.
Instead of looking around analyzing 30 different FX pairs randomly, you begin with the currencies that actually have the strongest fundamental backing.
That alone can saves hours of research.
So at a glance, you can see:
1. Which currencies are currently strongest
2. Which currencies are currently weakest
3. Where the best long vs short opportunities are
4. What the key market context is
5. Where the cleanest fundamental divergences are.
A PRACTICAL EXAMPLE...
The score has been showing the AUD among the most fundamentally supported currencies, while CHF among the weakest.
You do not need to immediately know every single detail behind that ranking.
You can, if you want, dive deeper into the logic by analyzing the details:
Or simply ask the AI Strategist.
Just click on the “Ask AI Strategist” button on top.
But the idea is simple:
The market context is currently more supportive for the AUD than it is for the CHF.
So your attention should naturally move toward AUDCHF upside.
That does not mean you can buy AUDCHF at any price.
No.
But it means you now have a bias.
Instead of looking at 30 random FX pairs, you are looking at the exact one where the fundamental contrast is strongest.
That is the power of the institutionals core.
It reduces the noise.
It gives you focus.
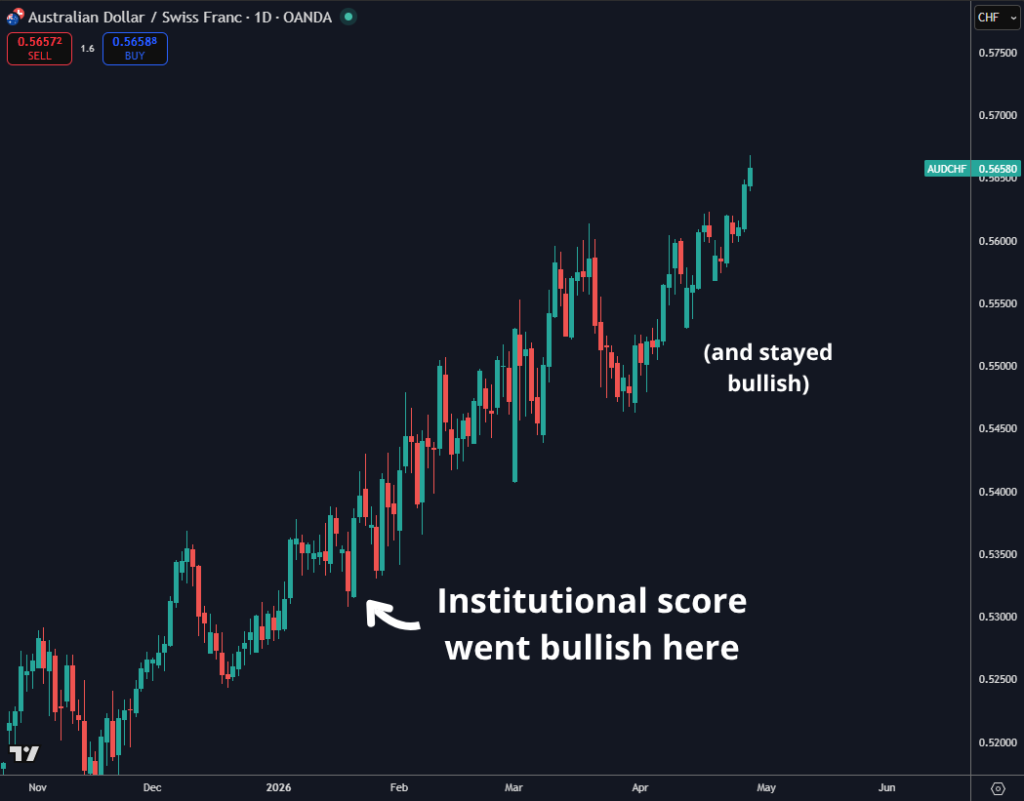
It helps you know where the story (hence the trend) is cleanest.
And he’s how AUDCHF has been performing since the score started showing the AUD in the “long bias” and the CHF in the “short bias”
Oh and by the way.
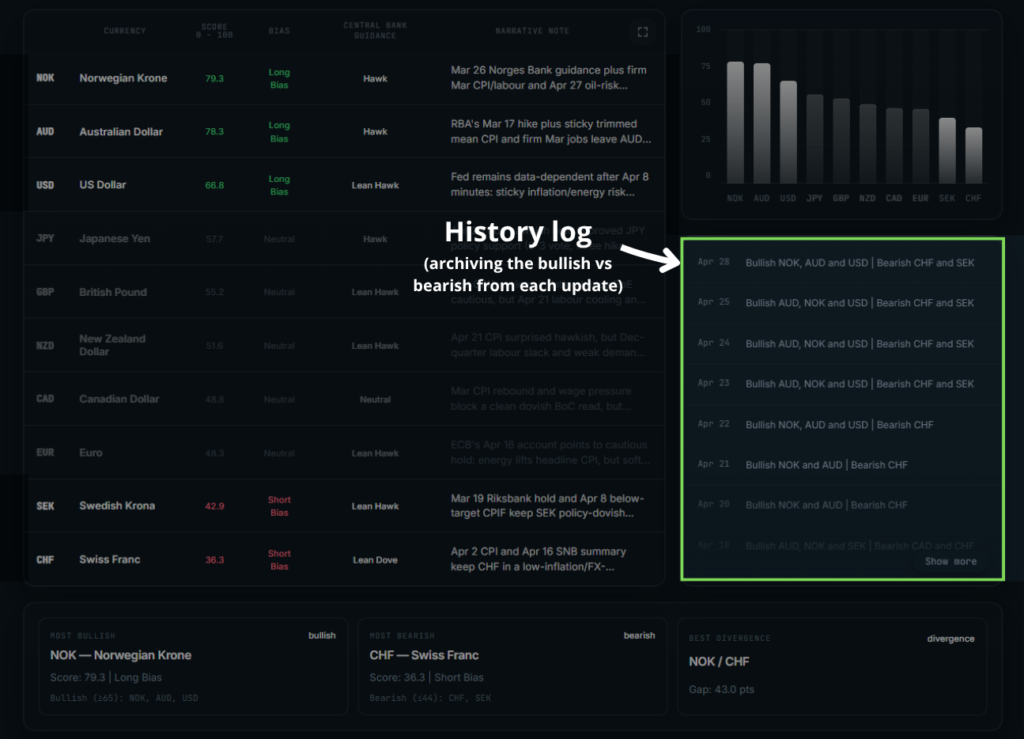
You can see a history log of all the bullish vs bearish currencies at every update:
This way you can backtest this with your strategy or just see historically what the context was at any given moment in time.
With that said...
This is what this tool does.
It does all the heavy lifting behind the scenes.
It analyzes:
1. Inflation, labor market, growth
2. Interest rate expectations
3. Forward guidance
4. Risk sentiment
5. Positioning
And it compiles everything into a straightforward score that tells us which currency is better positioned vs which one is more vulnerable in the current context.
That's the clarity that makes the difference...
Because once you know where the strongest story is and where the weakest story is, you stop wasting energy on every random move in the market.
You stop treating every chart like it deserves your attention.
You stop forcing trades in pairs where the fundamental edge is not really there.
And you become more selective.
Because you know exactly where to focus on, and in which direction.